
You open Substack Insights, see a decent open rate, and subscriber growth is still flat. One post lands inside the app, another pulls clicks from email, a Note gets some likes, and none of it tells you which channel deserves more of your time next week.
That’s the gap. Substack’s native numbers show activity. They rarely answer the question that actually matters, which is what to publish again, where to send it, and which of the ten browser tabs open right now is worth paying for. The honest list of substack analytics tools is shorter than most roundups suggest, and most of it depends on what kind of Substack you’re running.
We run WriteStack across our own publication and a wide set of client accounts, so we’ve had a real reason to try most of what’s out there. Below is what each tool actually does well, where it runs out of road, and what we’d reach for depending on the problem in front of us.
One number worth having before you start: WriteStack has close to 100 verified reviews from Substack writers across multiple platforms. Narrareach, StackSweller, and StackBuddy have none that we could find anywhere.
Table of Contents
- What Substack Insights Actually Shows You
- Sublytics: Churn and Revenue From Your Export
- Plausible Analytics: Attribution Before Substack
- Track Link: Click-Level Attribution
- Research Tools: StackDigest and Newsletrix
- Niche Tools: lttr.io and PingBell
- Narrareach: What It Does, and Where It Stops
- WriteStack: Analytics Tied to What You Publish Next
- Choosing the Right Substack Analytics Tools for Your Stack
If you only want the fast version: open the Notes performance view and see which of your last ten Notes actually pulled new subscribers instead of just likes. The rest of this list is for the pieces that view alone won’t cover.
What Substack Insights Actually Shows You
Substack Insights is where everyone starts, and it should be. The built-in analytics stopped being one screen a while ago. Substack organizes the Stats page into ten categories, Network, Audience, Retention, Sharing, Notes, Email, Surveys, Traffic, Unsubscribes, and Earnings, laid out in Substack’s own guide to metrics.
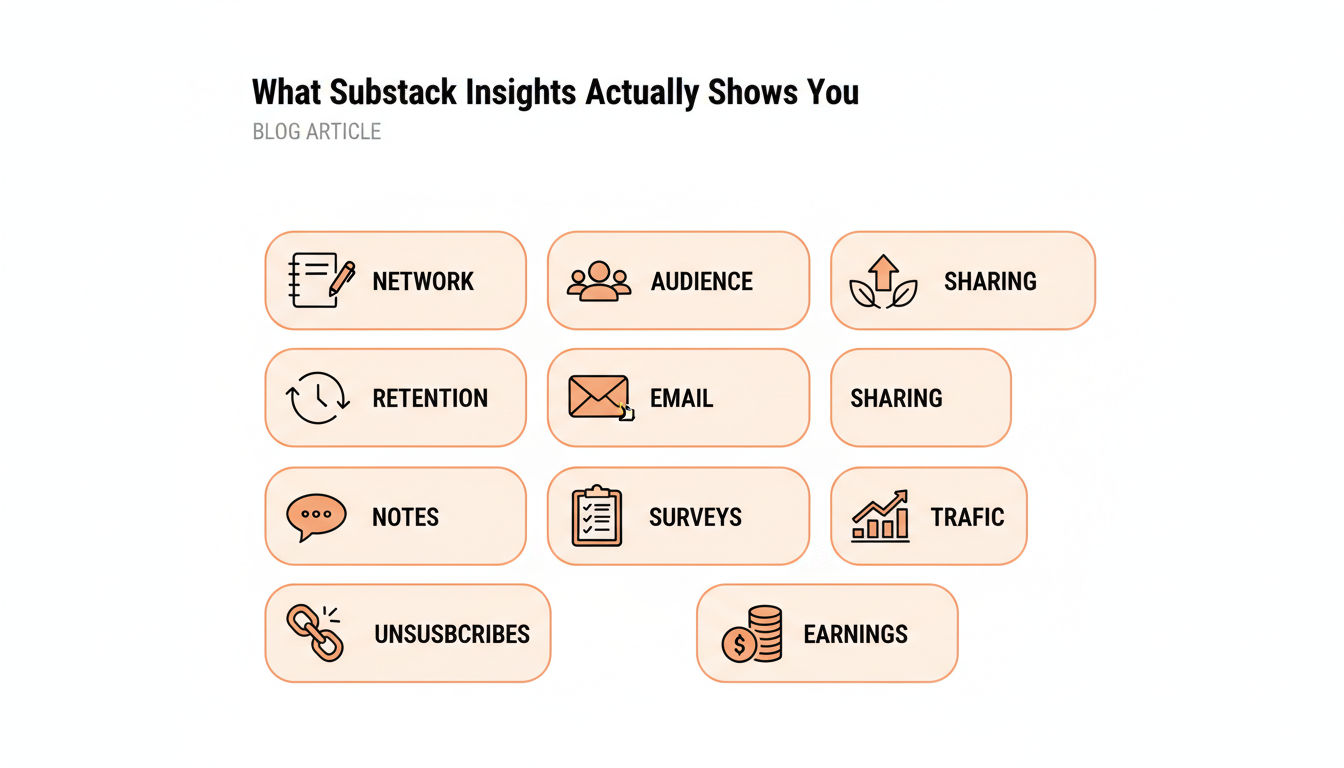
That structure is trying to describe a publication’s full lifecycle, not just how many people opened last Tuesday’s email. Retention shows paid net growth and paid cohort analysis side by side. Network shows how much growth is coming from inside Substack’s own discovery surfaces versus everywhere else.
For day-to-day publishing, this is still the fastest place to answer two questions: which post performed across web, email, and the app, and whether growth is coming from inside the Substack network or from outside links. It’s also the first place to notice when a Note is quietly outperforming the post it was meant to promote, which happens more often than most writers expect.
Practical rule: check Retention and Network before touching anything paid. If most of your growth is already coming through the Substack network, a discovery problem isn’t what needs fixing first.
Where it runs out of road is attribution once you leave Substack. Post the same idea to LinkedIn, X, and Notes, and native stats won’t reliably say which version actually drove someone to subscribe. That’s less a flaw than a boundary. Substack Insights answers what happened on Substack. Everything else on this list exists because that boundary is real.
Sublytics: Churn and Revenue From Your Export
Sublytics works differently from a live dashboard. Export your Substack data and upload it, and Sublytics turns that into churn, cohort, and revenue analysis built for a subscription business rather than single-post performance.
The trade-off is obvious. It isn’t real-time, and re-exporting a CSV every time you want fresh numbers gets old fast if you’re checking stats daily. For a monthly or quarterly review, that friction barely registers.
What it’s good at is the question native Substack answers weakest: which subscriber cohorts are actually sticking around, and where paid churn is building before it shows up as a bad month on the earnings tab. If a Substack is a subscription business first and a publishing habit second, that’s the more useful lens to look through.
Practical rule: don’t read single-post stats and cohort stats with the same urgency. One is a signal to act on this week. The other is a trend worth checking once a month, not once a day.
We’d reach for this specifically during a quarterly review, sitting next to a spreadsheet, not during the ten minutes before hitting publish.
Plausible Analytics: Attribution Before Substack
Plausible isn’t a Substack tool at all, and that’s exactly when it earns a spot in the stack. Substack doesn’t support Google Analytics or other tracking scripts on hosted pages, so Plausible only becomes relevant once something exists outside Substack: a landing page, a waitlist, a redirect layer readers pass through on the way to subscribing.
Once that setup exists, Plausible gives a clean, lightweight view of referrers, UTM campaigns, and goal completions, without the weight of a full Google Analytics account or a cookie banner to defend.
Practical rule: Plausible answers what happened before someone clicked into Substack. Substack Insights answers what happened after. Neither one covers both halves alone, and treating either as the full picture is how attribution gets lost.
The limitation is about expectation, not the software. If an entire funnel lives inside Substack with no external page in front of it, Plausible has nothing to measure. It’s built for writers doing real distribution work outside the platform, not for closing the attribution gap inside it.
Track Link: Click-Level Attribution
Track Link solves one specific problem: link-level attribution without standing up a full analytics stack. Swap a normal URL for a Track Link short link, and it returns click data by referrer, device, and rough location, with a free tier covering ten tracked links and 1,500 clicks a month.
That’s a good fit inside posts, Notes, and sponsor placements, anywhere the question is who clicked rather than what they did once they landed. Adoption is fast because there’s nothing to integrate. Replace the link, publish, check the dashboard.
What it won’t do is explain what happened after the click unless tracking is also built into the destination page. It’s an attribution layer, not a full substack analytics tool on its own, and it works best stacked on top of one.
Practical rule: the value collapses fast if link and UTM naming gets sloppy. Decide a naming convention before the first campaign goes out, not after the tenth one turns into a mess to untangle.
Sponsor reporting is where this tool earns its keep fastest. A clean click report is a better deliverable than a screenshot of native stats stitched together by hand.
Two tools in, and one pattern keeps repeating: measurement tools show what already happened. WriteStack’s Notes analytics is one of the only pieces on this list that turns that history into the next thing worth scheduling, in the same place the scheduling happens.
Research Tools: StackDigest and Newsletrix
StackDigest
StackDigest isn’t measuring a publication at all. It’s a discovery and research tool covering more than 2,000 newsletters and over 30,000 articles, indexed with semantic search and updated weekly. It earns its place before a run of content gets planned, not after it publishes: search a topic and see who else is covering it, how saturated a niche already looks, and where an angle is still thin.
That’s a real input into a content calendar even though it never touches subscriber data.
📅 Struggling to stay consistent on Substack?
WriteStack's Smart Scheduling lets you batch and queue Notes in minutes. Grow on Substack without burning out.
Explore Smart SchedulingNewsletrix
Newsletrix takes a lower-friction route to the same kind of research. Forward newsletters to a tracking address it provides, and it scores subject lines, detects the sending platform, and flags structural patterns like CTA placement and send timing, with a free plan covering two analyses a week.
Practical rule: use research tools before drafting and performance tools after publishing. Mixing the two up is how a competitive scan quietly turns into procrastination.
Neither StackDigest nor Newsletrix explains why last week’s Note underperformed. What they’re good for is sharpening what gets written next, based on what’s already working, or already oversaturated, across the newsletters nearby.
Niche Tools: lttr.io and PingBell
lttr.io
lttr.io is built around one specific growth channel: newsletter swaps. If cross-promotion partnerships are part of a growth plan, it helps find partners at a similar size, standardizes the swap ask, and shows tracked results instead of relying on a partner’s word for how a swap actually performed.
If swaps aren’t part of the plan, this one isn’t worth adding to the stack.
PingBell
PingBell turns a number, subscriber count, revenue, a launch-week goal, into something visible in real time on a screen, an overlay, or a public page. It’s built for livestreams, launches, and sponsor-facing moments where seeing the count matters almost as much as the count itself.
Practical rule: PingBell sits downstream of real analytics. It won’t diagnose a growth problem. It broadcasts one that’s already understood.
Narrareach: What It Does, and Where It Stops
Narrareach is a cloud dashboard that pairs Substack performance data with cross-posting to platforms including Medium, LinkedIn, and X, plus AI drafting meant to turn one essay into several shorter, platform-specific posts. Its own product pages describe reviewing article and Notes performance together and using that to prepare a next draft automatically, which is a genuinely useful idea.
The publishing mechanism is worth understanding before handing over an account. Narrareach’s own FAQ confirms that once a Note is scheduled, it publishes without a computer needing to stay on, because scheduling runs from Narrareach’s cloud dashboard rather than a writer’s own browser session. WriteStack works the opposite way: a browser extension paired with Substack’s own native scheduler, so a session never leaves the writer’s browser and no third-party server holds a login to publish on a writer’s behalf.
We’re not going to tell you that publishing from a third-party server is a confirmed violation of Substack’s Acceptable Use Policy, because we can’t verify that and neither should you take our word for it. We’re telling you what each company says about its own mechanism, with links, so it can be read in the exact wording.
Practical rule: if the publishing mechanism matters as much as the analytics, read both FAQs before comparing feature lists.
Beyond the mechanism question, Narrareach’s pricing page lists paid plans starting around $19.99 a month with a free trial and no card required to start. For a writer whose main growth lever is cross-posting to Medium specifically, that’s a reasonable pick, since Medium is one gap in WriteStack’s own cross-posting list. For a writer who wants the same repurposing loop without a cloud dashboard holding a session on their account, that gap matters less than the trade-off.
WriteStack: Analytics Tied to What You Publish Next
WriteStack starts from a different question than most of this list. Instead of asking what happened, it asks what to publish next, and builds the interface around answering that fast.
The analytics layer shows which specific Notes converted readers into subscribers, beyond simple like counts, with link-click history that covers a full Notes archive rather than resetting every 30 days. Layer in benchmarks against other publications, not only an account against its own past, and trend lines showing whether a restack rate is climbing or sliding month over month, and the dashboard starts answering “is this good” instead of only “is this different from last week.”
The part people don’t expect: WriteStack is the only Substack tool that schedules chat posts, not just Notes and articles. It also runs from a browser extension paired with Substack’s own native scheduler, so a writing session never leaves the browser.
We looked at 20,000 recent Notes across the accounts we work with. Multi-line Notes averaged about 11% more reactions and 28% more restacks than single-line Notes, and Notes between 150 and 300 characters outperformed anything under 50 characters by roughly a third on reactions, more on restacks. That’s the kind of pattern a single-account dashboard can’t surface, because it needs a wider sample to become visible at all.
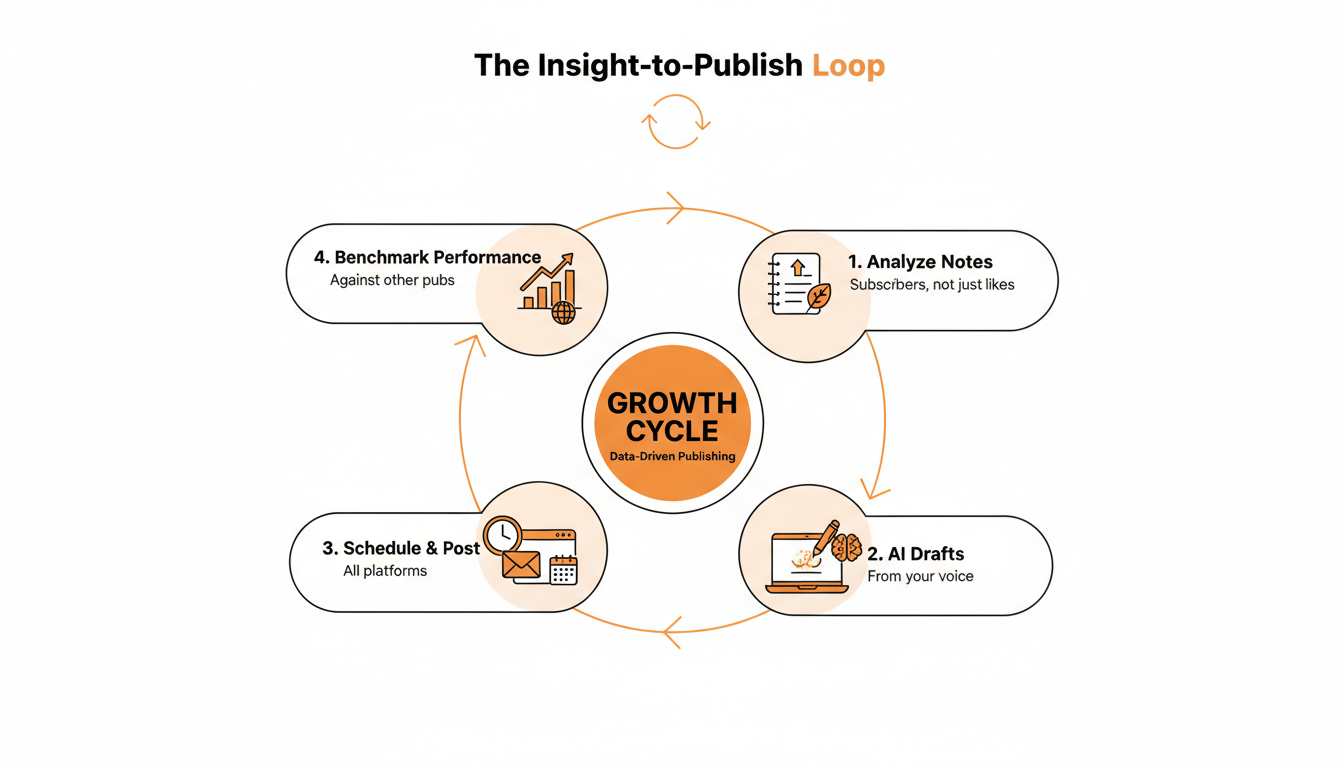
Layered on top, the AI note generator drafts from a writer’s own published Notes archive instead of a blank prompt, and can switch models if a first draft misses the writer’s voice. The fan view surfaces which subscribers are engaging most, useful before reaching out for testimonials or beta readers. A live inspiration feed updates from Notes activity in real time, so the loop looks less like “check dashboard, open a blank doc” and more like “see what worked, draft the next one, schedule it before the momentum drops.”
The honest gap: WriteStack cross-posts through Buffer to platforms including LinkedIn, X, and Threads, and Medium isn’t one of them yet. If Medium specifically is the whole reason to add a tool, that’s worth knowing before signing up.
There’s no permanent free tier either. The analytics layer, full Notes link-click history, cross-publication benchmarks, trend lines, isn’t something that samples well at a small monthly cap, so the 7-day trial gives full access instead of a limited slice. Compare the two limitations side by side before picking: no Medium cross-posting, or a trial window instead of a forever-free plan.
Choosing the Right Substack Analytics Tools for Your Stack
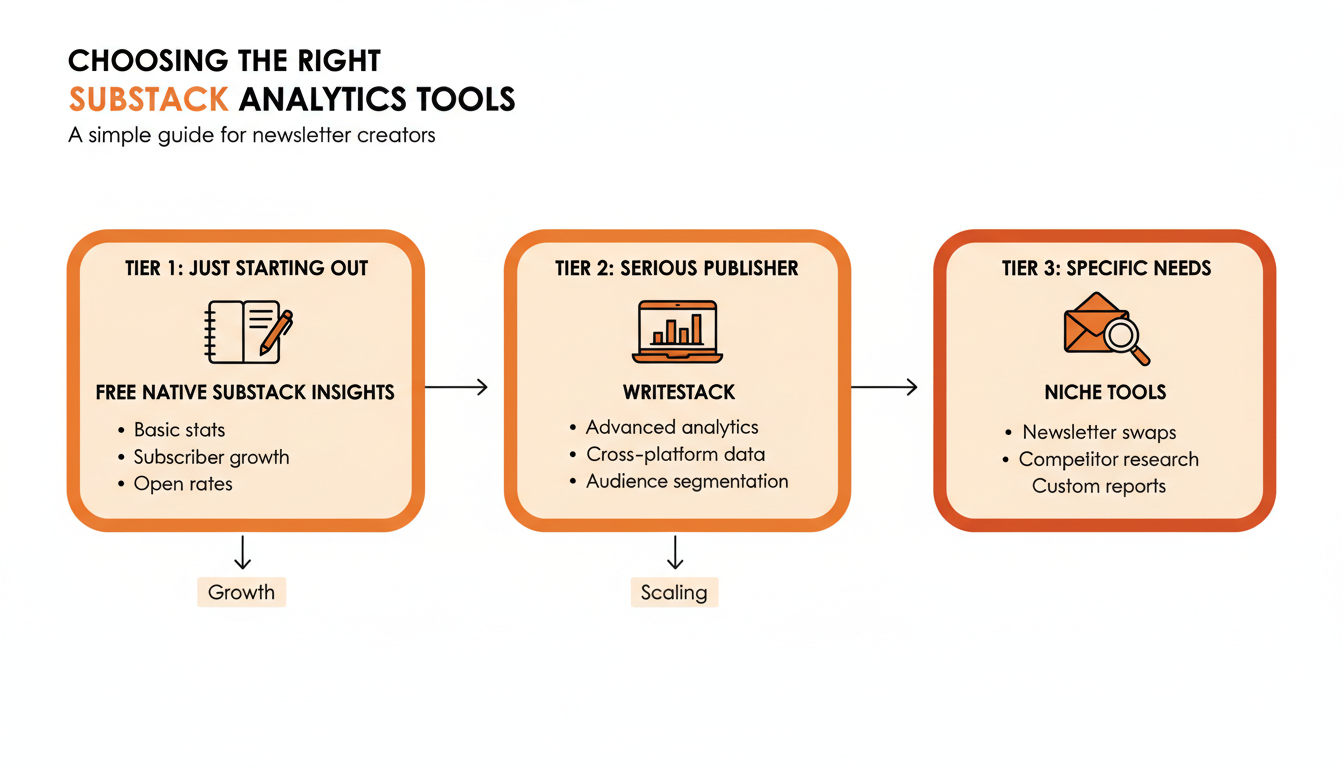
Nine tools in, the pattern holds. Research tools sharpen what to write about. Attribution tools like Plausible and Track Link explain how someone arrived. Sublytics explains whether they’re sticking around. None of them close the loop back into what to publish next, which is the actual decision every one of these numbers is supposed to inform.
Here’s how the two closest competitors in that specific category compare against the free baseline:
| Substack Insights (native) | Narrareach | WriteStack | |
|---|---|---|---|
| Chat post scheduling | No | No | Yes |
| Notes link-click history | No | Not stated publicly | Full archive |
| Benchmarks vs. other publications | No | No | Yes |
| Trend analysis over time | Limited (Retention tab) | Not stated publicly | Yes |
| AI drafts from your own Notes | No | Pattern-based (Reach AI) | Drafts from full archive, model-switchable |
| Publishing mechanism | N/A | Cloud dashboard | Browser extension + native scheduler |
| Medium cross-posting | N/A | Yes | No |
| Public reviews found | N/A | None found | ~100 |
| Starting price | Free | Free trial, plans from ~$19.99/mo | 7-day free trial, full access |
Practical rule: treat this table as a scoreboard, not a menu. Most writers don’t need six tools running at once. They need one that measures and one that closes the loop back into publishing, and sometimes that’s the same tool.
Substack Insights is enough while just starting out and getting a feel for what lands. Once publishing gets serious, and especially once the same idea is going out to more than one platform, the question changes from “what happened” to “what do I do with what happened,” and that’s where most of this list, including Narrareach, stops short.
For most Substack writers trying to grow past a few hundred subscribers, WriteStack is the tool that closes that loop without an extra login for a cloud dashboard to hold. Load a week of Notes in twenty minutes and watch the ones that convert get flagged automatically, ready to reschedule instead of getting rewritten from scratch six weeks later.
If StackDigest sharpens what to write about and Track Link shows which link earned the click, WriteStack is the layer that turns all of it into the next thing that actually gets published.