

If you just checked your Substack dashboard and saw a 38% open rate, you might be wondering if that's good or a warning sign. The honest answer depends on where you're comparing it to, because Substack email open rates run far higher than the rest of the email world, and that changes what "good" even means here.
I pulled together the actual benchmark numbers, the reasons Substack opens skew high, why your rate naturally drops as your list grows, and the specific levers that move it. No vague advice about "engaging content."
Table of contents
- What counts as a good Substack open rate
- Why Substack opens run higher than normal email
- Why your open rate number isn't as precise as it looks
- Why your open rate drops as your list grows
- How Substack compares to Kit and beehiiv on open rate
- The four things that actually move your open rate
- A quick deliverability checklist before you touch anything else
- Open rate isn't the only number that matters
- Tracking your open rate over time
- FAQ: Substack open rates
What counts as a good Substack open rate
For most creator newsletters on Substack, a healthy open rate sits between 30% and 60%. Substack itself has publicly noted that active publications frequently see open rates in the 40-50% range, and paid newsletters often run higher than that because paying subscribers are already more invested in the content.
Here's how that stacks up against the numbers you'd find anywhere else:
| Newsletter type | Typical open rate |
|---|---|
| General business email (industry average) | 21-32% |
| Creator newsletter on Substack (free tier) | 35-50% |
| Substack paid subscriber emails | 50-70% |
| Substack list under 1,000 subscribers | Often 60%+ |
| Large Substack list (10,000+) | Often 30-40% |
Practical rule: if your open rate sits above 40% and isn't sliding month over month, you're in healthy territory. Below 20% is the range where it's worth investigating your list quality and subject lines, not your writing.
Why Substack opens run higher than normal email
Three platform mechanics explain most of the gap between Substack and a typical email marketing tool.
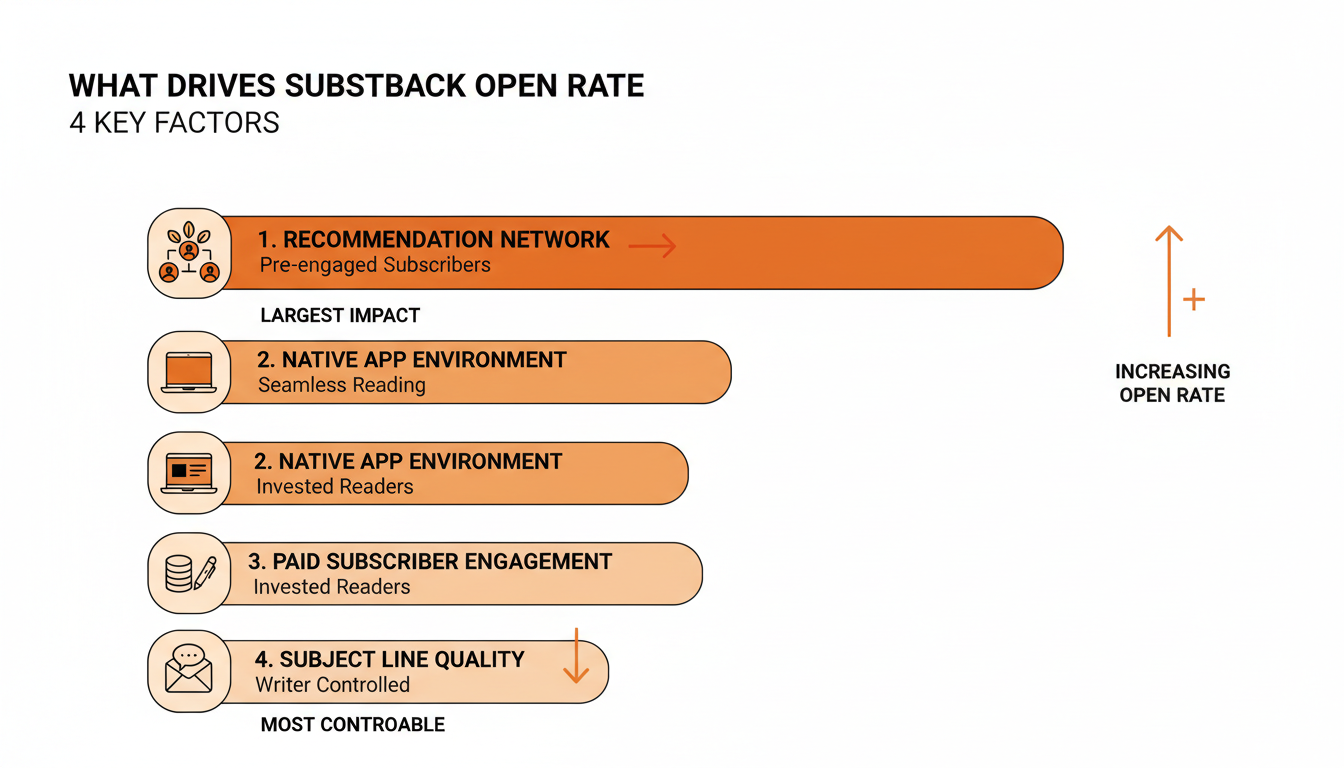
Substack's recommendation system routes new subscribers in through other writers they already read, so a chunk of your list arrives pre-engaged instead of cold. The native iOS and Android apps keep readers inside a dedicated reading environment rather than a shared inbox competing with promotions and receipts. And because a meaningful share of Substack's total open-rate average comes from paid subscriptions, where people are opening emails they're paying for, the platform-wide numbers get pulled upward compared to a marketing list built from lead magnets and cold signups.
Substack's own guide to metrics confirms this: they explicitly frame their open-rate benchmarks against curated, opt-in reading relationships rather than transactional marketing email, which is a different comparison than most open rate research is built around.
Why your open rate number isn't as precise as it looks
Open rate tracking on every email platform, Substack included, works by loading a tiny invisible image (a tracking pixel) when someone opens your email. The platform counts that image load as an open. This system has a well-documented flaw: Apple Mail Privacy Protection, active on a large share of iPhone and Mac users, pre-fetches every image in an email as soon as it arrives, whether or not the recipient ever opens it.
That means a subscriber who never reads your email can still register as an "open" simply because their inbox pre-loaded the image on delivery. Reporting on the broader email industry has found that Apple Mail Privacy Protection can inflate reported open rates by 15-40% depending on how much of a list reads on Apple devices, and some publications saw unique open rates nearly double within months of the feature rolling out.
Practically, this means two things for a Substack writer. First, your real, human open rate is very likely lower than the number on your dashboard. Second, and more useful, this doesn't change how you should use the metric: compare your own numbers over time rather than chasing an absolute percentage, since the inflation is roughly constant across your list and doesn't distort the trend line nearly as much as it distorts the raw figure.
Practical rule: don't panic-optimize over a single point-in-time open rate number. Watch the 4-8 week trend for your own list, and treat click-through rate as a cleaner secondary signal since Apple's pre-fetching doesn't fake a click.
Why your open rate drops as your list grows
This is the part that catches almost every growing Substack writer off guard: your open rate falling as your subscriber count climbs is not automatically a problem.
The dilution effect
Your first 200 subscribers are usually friends, people who found you through a specific post they loved, or readers who actively sought you out. That group opens almost everything. As your list scales into the thousands, you pick up subscribers from recommendations, cross-posts, and passive discovery who are curious but less committed. Averaged across a bigger, more varied list, the rate naturally settles lower even though your total number of opens keeps climbing.
When a falling rate is actually fine
Look at the trend of total opens, not just the percentage. If your open rate went from 55% to 38% but your subscriber count tripled over the same stretch, your total engaged readers likely grew too. That's a healthy newsletter, not a declining one.
Practical rule: track open rate and raw open count side by side. A shrinking percentage next to a growing raw number is dilution. A shrinking percentage next to a flat or shrinking raw number is a real problem.
Here's a rough illustration of how this plays out over a year of consistent growth:
| Milestone | Subscribers | Typical open rate | Approx. total opens per post |
|---|---|---|---|
| Launch month | 150 | 65% | 98 |
| 6 months in | 1,200 | 48% | 576 |
| 12 months in | 5,000 | 36% | 1,800 |
| 24 months in | 15,000 | 30% | 4,500 |
The percentage keeps falling while the actual audience reading each post keeps growing by a wide margin. That's the pattern to watch for instead of reacting to the headline number alone.
How Substack compares to Kit and beehiiv on open rate
If you've used another email platform before moving to Substack, or you're weighing whether to migrate off it, the open rate comparison is one of the more common questions writers ask. General email marketing platforms like Kit and beehiiv report open rates closer to the broader industry range, since their lists are built from a mix of lead magnets, opt-in forms, and paid acquisition, not Substack's built-in discovery network.
| Platform | Typical creator open rate | Primary driver |
|---|---|---|
| Substack (free tier) | 35-50% | Recommendation network, native app |
| Substack (paid tier) | 50-70% | Paying, highly invested subscribers |
| Kit (formerly ConvertKit) | 25-40% | Depends heavily on list source and segmentation |
| beehiiv | 30-45% | Similar discovery tools to Substack, smaller network effect |
| General email marketing average | 21-32% | Mixed transactional and promotional sends |
The gap narrows the more a platform invests in its own discovery and recommendation layer, and widens for lists built primarily through paid ads or embedded signup forms on a website. If you're comparing your own numbers against these figures, match your list's acquisition source to the closest row rather than assuming every "creator newsletter" benchmark applies equally.
The four things that actually move your open rate
📅 Struggling to stay consistent on Substack?
WriteStack's Smart Scheduling lets you batch and queue Notes in minutes. Grow on Substack without burning out.
Explore Smart SchedulingSubject lines
Specific, concrete subject lines consistently outperform vague or "clever" ones. A subject line that promises a clear outcome or names the actual topic beats a teaser every time in Substack's own reporting. Avoid subject lines that read like ad copy. Substack readers open newsletters that sound like a person wrote them, not a marketing team.
Send day and time
Aggregate research across creator newsletters points to Tuesday and Thursday as the strongest send days, with afternoon sends (particularly around 2-4pm in the recipient's local time zone) outperforming early morning blasts that get buried under overnight email. This isn't a universal rule for every niche, so treat it as a starting point to test against your own audience rather than a fixed schedule.
see best times to post benchmarks based on real Substack data
Segmentation
Sending the same email to your entire list regardless of engagement history leaves opens on the table. Substack lets you filter sends to paid subscribers, free subscribers, or subscribers who've engaged recently. Writers who segment even loosely, for example sending a paid-only update separately from a broad free post, tend to see meaningfully better open rates on both sends because each message is more relevant to the group receiving it. See which of your subscribers are your most engaged fans before you decide how to split a send.
List hygiene
A list padded with abandoned inboxes, spam-trap addresses, or subscribers who haven't opened anything in six months will drag your average down no matter how good your writing is. Reviewing your subscriber list periodically and removing addresses with zero engagement over a long stretch protects both your open rate and your deliverability, since inbox providers watch engagement signals when deciding whether your future emails land in the inbox or the spam folder.
A quick deliverability checklist before you touch anything else
Before assuming a low open rate is a content problem, rule out deliverability. A handful of technical issues will suppress opens regardless of how good your subject lines are.
Check whether your emails are consistently landing in the primary inbox versus promotions or spam by asking a few subscribers on different email providers (Gmail, Outlook, Yahoo) to check where your last few sends landed. A pattern of spam placement points to a sender reputation issue rather than a content issue.
Look at your bounce rate on recent sends. A rising bounce rate usually means your list has accumulated dead addresses, which both wastes sends and signals to inbox providers that your list quality is declining.
Review whether you've had a recent spike in unsubscribes or spam complaints right after a specific post. That's often a sign the post's framing or frequency, not the list itself, triggered the drop.
Practical rule: run this checklist before changing subject line style or send time. Fixing a deliverability issue can move your open rate more in one send than months of subject line testing.
Open rate isn't the only number that matters
Open rate gets attention because it's the first metric on the dashboard, but it's a blunt instrument. It doesn't tell you whether someone read three sentences or the whole post, whether they clicked through, or whether they came back next week. A post with a mediocre open rate but a high click-through and comment rate is often doing more for your growth than a high-open, low-engagement post that people glance at and archive.
Practical rule: treat open rate as a health check, not a scoreboard. Watch it for sudden drops (a deliverability warning) and long-term trend (a list-quality signal), but judge individual posts on reads, comments, and shares.
Tracking your open rate over time
Substack's native dashboard shows you open rate per post, but it's not built for spotting trends across months or comparing your performance against your own historical baseline at a glance. If you're trying to figure out whether a recent dip is dilution, a bad subject line, or a real deliverability issue, you need to see the pattern, not just the last number.
WriteStack's full platform overview pulls your posting and engagement history into one view so you can see open rate trends alongside your best-performing days, subjects, and formats, instead of scrolling back through individual posts to piece it together manually.
FAQ: Substack open rates
Is a 25% open rate bad on Substack? Not necessarily. It's below the 30-60% range most healthy creator newsletters land in, but check whether it's a single low-performing post (likely a subject line issue) or a sustained trend across your last 10-15 posts (worth a list hygiene review).
Why did my open rate suddenly drop? Sudden, sharp drops usually point to a deliverability issue: emails landing in spam or promotions instead of the primary inbox. Gradual declines over months are more often dilution from list growth.
Does open rate affect the Substack algorithm or recommendations? Substack hasn't published exact ranking mechanics, but engagement signals broadly, including opens, clicks, and reads, are consistent with how the platform's discovery and recommendation systems favor publications with active, engaged readers.
Should free and paid subscribers be compared on the same open rate? No. Paid subscriber open rates typically run well above free subscriber rates because paying readers are more invested. Blending them into one number can hide problems in either segment.
How often should I check my open rate? Weekly is enough for most writers. Checking after every single post tends to produce reactions to noise, since a single post's open rate can swing several points based on subject line alone. Monthly or quarterly review is better for spotting real trend shifts and deciding whether a list cleanup or deliverability check is overdue.
Does unsubscribing inactive readers hurt my growth numbers? It can lower your total subscriber count in the short term, but it protects your open rate, your deliverability reputation, and the accuracy of every other metric you track. A smaller list of engaged readers is worth more than a larger list padded with people who never open your emails, both for your own reporting and for how inbox providers treat your future sends.
Is there a minimum list size before open rate benchmarks apply? Benchmarks get noisy under a few hundred subscribers, where a handful of highly engaged early readers can push your rate well above 60-70% regardless of your niche. Treat early numbers as encouraging rather than diagnostic, and start comparing against the standard benchmarks once your list clears a few hundred subscribers and a few months of send history.
If you want to stop guessing at your open rate trend and actually see it mapped against your posting schedule, try WriteStack's analytics and get the full picture in one place instead of scrolling through individual post stats.