
A cancellation notification lands on a Tuesday. You read the name, try to remember which post that person might have opened last, and spend the rest of the afternoon quietly deciding your writing has gotten worse. Your paid subscriber count went up this month. Your churn went up too. Both things happened at once, and neither number by itself tells you what is actually going on with your readers.
Substack subscriber churn is a measurement problem long before it is a writing problem: the number that made you anxious is sitting in a tab most writers never open, and the context that would tell you whether it is actually bad is not in your dashboard at all. This piece covers what churn measures on Substack, why readers really leave, how to read the Retention tab without misreading it, and what a sample of over 3 million posts says about the advice that posting more often is what keeps an audience around.
One number worth having before you start: WriteStack has close to 100 verified reviews from Substack writers across multiple platforms. The other tools writers reach for to track Substack growth have none that we could find anywhere. That gap matters more than usual on this topic, because retention work means trusting somebody else's math about your own publication.
Table of Contents
- What Substack Subscriber Churn Actually Means
- Why Substack Readers Actually Unsubscribe
- How to Read Your Substack Retention Tab
- Where the Retention Tab Stops Being Enough
- What the Data Says About Posting Rhythm and Engagement
- Fixing Onboarding: The First 30 Days
- Free-to-Paid Conversion vs. Retention
- A Five-Step Churn-Reduction System
- What Three Months of Watching the Right Numbers Changes
What Substack Subscriber Churn Actually Means
Churn is the percentage of subscribers who cancel or stop renewing over a given period. On Substack it splits into two separate problems that get treated as one: free subscriber churn (people unsubscribing from your free list) and paid churn (people canceling a paid subscription or letting it lapse).
Substack's own Stats page has a Retention section built for exactly this. It shows four dashboards: paid net growth, paid cohort analysis, paid churn, and free subscribers, according to Substack's own guide to publication metrics. If you have payments turned on, this data already exists in your dashboard. Most writers just have not gone looking for it.
There is no single "normal" churn number Substack publishes for the whole platform, and most of the round figures that circulate online (a flat annual percentage, a fixed monthly rate) are estimates from third parties rather than something Substack discloses. Your own trend over time is the number that matters, and after that, how your trend compares to publications built like yours.
That distinction matters because writers who chase an external benchmark tend to solve the wrong problem. A publication with a small, highly engaged list can show a scary-looking monthly churn percentage off a tiny base (three cancellations out of forty paying subscribers reads as a large percentage) while a publication with thousands of paid subscribers can lose the same three people and barely register a blip. Percentage-based panic without checking the underlying count is one of the most common reasons writers overreact to a normal month.
The same logic runs in the other direction. A publication growing fast will often show a rising raw cancellation count at the same time its churn rate is improving, because the base it is measured against keeps growing too. Look at both the rate and the raw numbers behind it before deciding a month was bad.
Practical rule: a single month of high churn driven by one cohort canceling together (a price increase, a paid promo ending, an annual renewal batch) is a different problem than a slow monthly bleed of one or two subscribers. Check the cohort analysis before reacting to the raw percentage.
Reading your own numbers correctly is step one. Reading them against the field is the step that ends the guessing, and it is the step Substack's dashboard cannot take for you. WriteStack benchmarks your engagement and retention signals against other publications your size, so "my churn went up" stops being a mood and becomes a comparison. Start a free 7-day trial and put your numbers next to the field instead of next to last month.
Why Substack Readers Actually Unsubscribe
Readers leave for reasons that are mostly boring and mostly preventable. The paid content stopped feeling meaningfully different from what is free. The relationship they expected when they upgraded turned into a content library with no acknowledgment that they exist. Onboarding was confusing or nonexistent, so the value never got explained. Money got tight, or attention got redirected somewhere else, and your newsletter was the easiest recurring charge to cut.
Inbox fatigue plays a real role too. A survey on email overload found that 75% of professionals actively unsubscribe from newsletters they consider infrequent or low-value, based on Mailbird's 2025 survey as reported by Readless. That cuts both ways: writers who post rarely get pruned for feeling absent, and writers who post constantly with nothing new to say get pruned for feeling like noise.
None of these reasons are unique to Substack. What is different here is how visible the decision to leave is. A reader unsubscribing from your Substack sees your name and your last post title on the confirmation screen, sometimes right after reading something that did not land. The exit is tied to a specific moment, which means the fix is usually tied to a specific moment too, not a vague need for "better content."
Finding that moment is where most churn investigations stall. You know roughly when the losses happened. You do not know what those readers saw first, which is almost always a Note rather than a post, since Notes are how most new subscribers meet a publication now. WriteStack tracks link clicks across your full Notes history, down to which of the two links inside a single Note got clicked, going back to your very first one. That turns "we lost people in March" into "the Note that brought most of them in was pitching a series I stopped writing in February."
Free Subscriber Churn vs. Paid Subscriber Churn
Free unsubscribes usually mean a topic or format mismatch. Someone joined expecting one thing, got something else for a few sends, and left. This kind of churn is cheap to diagnose: look at what post triggered the spike and check whether your About page and welcome email actually describe what you write.
The harder half of that diagnosis is the acquisition side. If a Note that overpromised on one narrow topic drove 300 signups, the unsubscribes that follow six weeks later are not a content quality problem at all, they are an inherited mismatch. Link-click history makes that traceable, because you can see which Notes actually sent people to your archive versus which ones collected likes and moved on.
Paid cancellations are a value judgment, not a mismatch. The reader liked your work enough to pay once. When they cancel, they are telling you the ongoing price no longer matches what they are getting, or that something in their life changed and your newsletter lost the argument for staying on the list.
The Value Gap Problem
The single biggest driver of paid churn is a paid tier that does not feel different enough from the free tier. If a subscriber can get 90% of the value without paying, the other 10% has to be worth the price on its own, and for most writers it is not framed clearly enough to survive a subscriber's quarterly "do I still need this" moment.
Chat is one of the few paid-only surfaces that does relationship work without requiring another full post, and it is also the surface writers abandon fastest, because it demands presence at unpredictable times. WriteStack is the only Substack tool that schedules chat posts at all, which means a paid-subscriber thread can go out on a Thursday morning whether or not you are at your desk. A paid tier that includes a reliable weekly chat reads very differently at renewal time than a paid tier that includes three archived threads from last spring.
Practical rule: if you cannot describe your paid-only value in one sentence a free subscriber would understand, that sentence does not exist yet, and that is the actual retention project, not a new content idea.
How to Read Your Substack Retention Tab
Substack's Retention tab is not hidden, but it is easy to misread if you do not know what each section is actually measuring.
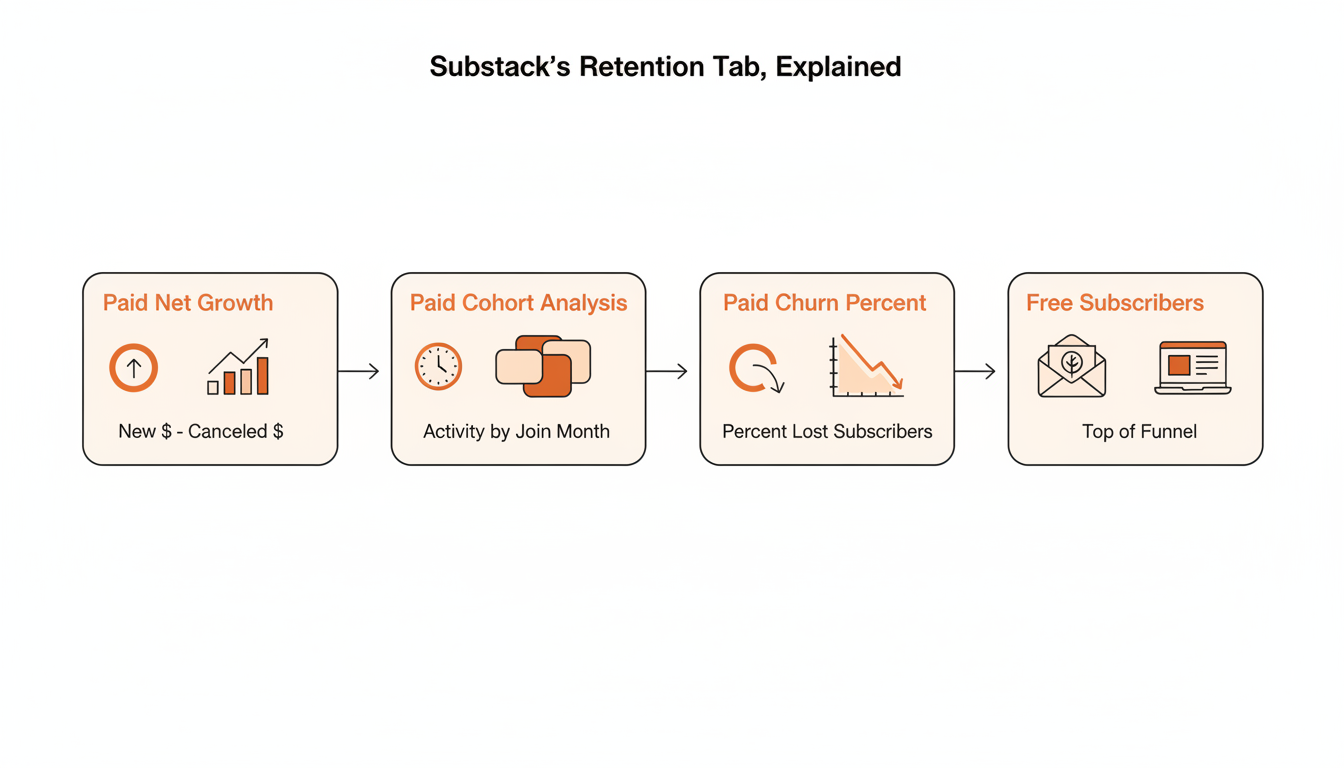
Paid net growth nets new paid subscriptions against cancellations for a period. A flat or negative line does not always mean high churn. It can mean growth slowed while churn stayed steady.
Paid cohort analysis groups subscribers by the month they joined and tracks what percentage of each group is still paying over time. This is the dashboard that actually tells you whether retention is improving. A healthy cohort curve dips in the first month or two and then flattens. A worrying one keeps sloping downward with no floor.
Paid churn is the percentage figure most writers fixate on. It is useful for a monthly gut check, but on its own it cannot tell you whether this month's cancellations came from one bad cohort or a genuine trend.
Free subscribers tracks list growth and losses on the free side, which is where topic-mismatch churn shows up first, usually well before it becomes a paid-subscriber problem.
Reading a cohort curve is simpler than it looks. Pick everyone who converted to paid in a given month and follow the percentage of that group still paying at one month out, three months out, and six months out. A healthy curve drops early (some cancellations are normal, people try things and decide it is not for them) then flattens into a long, mostly-horizontal line. An unhealthy curve keeps sloping downward with no flattening point in sight, which means something ongoing is pushing people out well past the point where a first-impression mismatch would explain it.
Practical rule: check cohort analysis before paid churn. The percentage tells you something happened. The cohort curve tells you whether it is getting better or worse.
📅 Struggling to stay consistent on Substack?
WriteStack's Smart Scheduling lets you batch and queue Notes in minutes. Grow on Substack without burning out.
Explore Smart SchedulingWhere the Retention Tab Stops Being Enough
Everything above is a per-account view. It compares you to you. That is enough to spot a change and nowhere near enough to know what the change means, which is why churn investigations so often end with a writer staring at a downward line and guessing.
Two questions break a per-account dashboard entirely. The first is "is this bad?" A 4% monthly paid churn figure is either fine or alarming depending on your size, your price, and how you acquired those subscribers, and a dashboard that only knows your account structurally cannot tell you where you sit against publications built like yours. The second is "what caused it?" Cohort analysis tells you which month a group joined. It says nothing about what that group saw before they subscribed, which is the piece that would let you fix acquisition instead of blaming your writing.
WriteStack was built for this layer specifically, and it is worth being concrete about which question each part of it answers.
| The question you are actually asking | Substack's own Stats | WriteStack |
|---|---|---|
| Is my churn normal for a publication my size? | No, per-account view only | Yes, benchmarks against other publications |
| Which Note sent people to my archive, and which just collected likes? | No | Yes, link-click tracking across your full Notes history |
| Is my retention climbing or sliding month over month? | Cohort snapshots, read manually | Yes, trend analysis over time |
| Which readers are engaging most right now, before they go quiet? | Partial | Yes, most engaged readers surfaced as a list |
| Can I schedule chat posts for paying subscribers? | No | Yes, and no other tool in the category does |
| Can I draft Notes from what I have already published? | No | Yes, with model selection if a draft misses |
| When does my specific audience actually engage? | No | Yes, posting and engagement heatmap |
| Verified reviews from Substack writers | Not applicable | ~100 across multiple platforms |
WriteStack's pricing runs three tiers, all with a 7-day free trial and no free-forever plan. The analytics layer is the product, and link-click history, cross-publication benchmarks, and month-over-month trend analysis cannot be meaningfully sampled at 30 Notes a month. The trial gives you all of it instead of a fraction.
Start your free trial and find out in one sitting whether your churn is a problem or a normal month for a publication your size.
What the Data Says About Posting Rhythm and Engagement
A common piece of retention advice is to post more often so subscribers do not forget you exist. We pulled a sample of over 3 million Substack posts and grouped each one by the gap since that publication's previous post, then compared each post's reaction count to that same publication's own average (so a big newsletter and a small one both count on equal footing). Here is what came out.
| Gap since previous post | Posts in sample | Reactions vs. that publication's own average |
|---|---|---|
| 0-3 days | 866,426 | 0.93x |
| 3-7 days | 822,657 | 0.99x |
| 7-14 days | 712,231 | 1.01x |
| 14-30 days | 392,368 | 1.07x |
| 30+ days | 237,926 | 1.18x |
Posts published after a longer gap since the previous one tend to land better relative to that publication's own baseline, not worse. Posts sent within three days of the last one landed about 7% below that publication's average, while posts sent after a 30-plus day gap landed nearly 18% above it.
This is not proof that posting less reduces churn. It measures reaction volume on a single post relative to a publication's own history, not subscriber retention over time, and there is an obvious selection effect: writers likely save bigger, higher-effort ideas for the posts they have been sitting on longer. But it does undercut the assumption that daily or near-daily posting is what keeps an audience engaged. For a lot of writers, the real lever is matching each post's effort and timing to what the idea deserves, not hitting a fixed publishing quota.
There is a second reading of this data worth sitting with. If frequent, low-gap posting were the main thing keeping subscribers around, you would expect those posts to at least hold their own against a publication's baseline. Instead they consistently underperform it, which suggests whatever retention benefit comes from frequency is being offset by lower per-post effort when posts are rushed out close together.
The platform-wide average is a starting point, not your answer. Your own audience's rhythm can look nothing like it, and WriteStack's heatmap of which days and times your specific audience actually engages removes the guesswork. What most writers find when they look is that they have been posting into their two worst windows for months without knowing it, which reads as an engagement decline and gets treated as a content problem.
The part people don't expect
The three things that end a churn investigation fastest are not in any newsletter dashboard. WriteStack tracks link clicks across your entire Notes history, per link inside each Note, going back to your first one, so you can tell which Notes sent people to your archive and which ones just collected likes from readers who never came back. It benchmarks your engagement against other publications your size, which answers "is this bad" instead of "is this worse than last month," a question a per-account dashboard structurally cannot answer. And it runs trend analysis month over month, so you see direction rather than a single anxious snapshot. Open the dashboard on a Tuesday and see that the Note you almost did not post drove 40 people into the archive, and that your retention curve has been flattening for eleven weeks. Not better than last week. Better than the field.
Fixing Onboarding: The First 30 Days
Most preventable churn happens in the first month, and most writers spend zero deliberate effort on it. A reader who subscribes and gets silence, or gets a generic auto-reply with no sense of what is coming next, has no reason to stick around when the next full send does not match what they expected.
The Welcome Sequence
A welcome email that sets expectations (what you write about, how often, what is free versus paid) does more retention work in one message than three months of good posts sent to someone who never had those expectations set. It does not need to be clever. It needs to be accurate, and it needs to describe a publishing rhythm you will actually hold, which is easier to promise once WriteStack is holding the schedule instead of your memory.
The First Post Problem
The first post a new subscriber actually reads matters more than your best post ever will, because it is the one deciding whether they open the second one. If your best material is buried in your archive, a pinned or resurfaced post that represents your actual range gives new subscribers a fair first impression instead of whatever happened to publish that week.
This is where a lot of otherwise solid publications lose people quietly. A reader signs up after seeing one strong piece shared somewhere, lands in an inbox that has not sent anything in ten days, and the next thing they see is a post on a completely different topic with a different tone. Nothing about that experience is a content quality problem, but it produces the same unsubscribe as one.
The gap between full posts is the part you can close without writing more. A queue of Notes scheduled across the ten quiet days keeps a new subscriber seeing your name in a context they chose, and it costs one sitting rather than ten decisions. WriteStack's Notes generator drafts from Notes and posts you have already published, so the queue starts in your voice instead of arriving at it after three rounds of editing, and every competitor in this category generates from a blank prompt instead.
Practical rule: audit your welcome email once a quarter. If it still describes a publication you have since pivoted away from, it is actively creating churn on autopilot.
Free-to-Paid Conversion vs. Retention
Getting someone to convert from free to paid and keeping them paying are different problems with different fixes, and treating them as the same thing is how writers end up pulling the wrong lever.
| Free subscriber churn | Paid subscriber churn | |
|---|---|---|
| Typical trigger | Topic or format mismatch, inbox cleanup | Price no longer matches perceived value, life circumstances |
| Where it shows up first | Free subscriber count, unsubscribe list | Paid churn %, cohort analysis |
| Fastest fix | Sharper About page, clearer topic promise up front | A paid-only value that is easy to state in one sentence, direct acknowledgment of paying readers |
| What tells you the cause | Which Note or post drove that cohort in, via link-click history | Cohort curve shape, benchmarked against publications your size |
Practical rule: a spike in free unsubscribes after a specific post is a targeting signal, not a retention crisis. A slow decline in your paid cohort curve over several months is the one that needs a real fix.
A Five-Step Churn-Reduction System
None of this requires a bigger content calendar. It requires a short, repeatable monthly check.
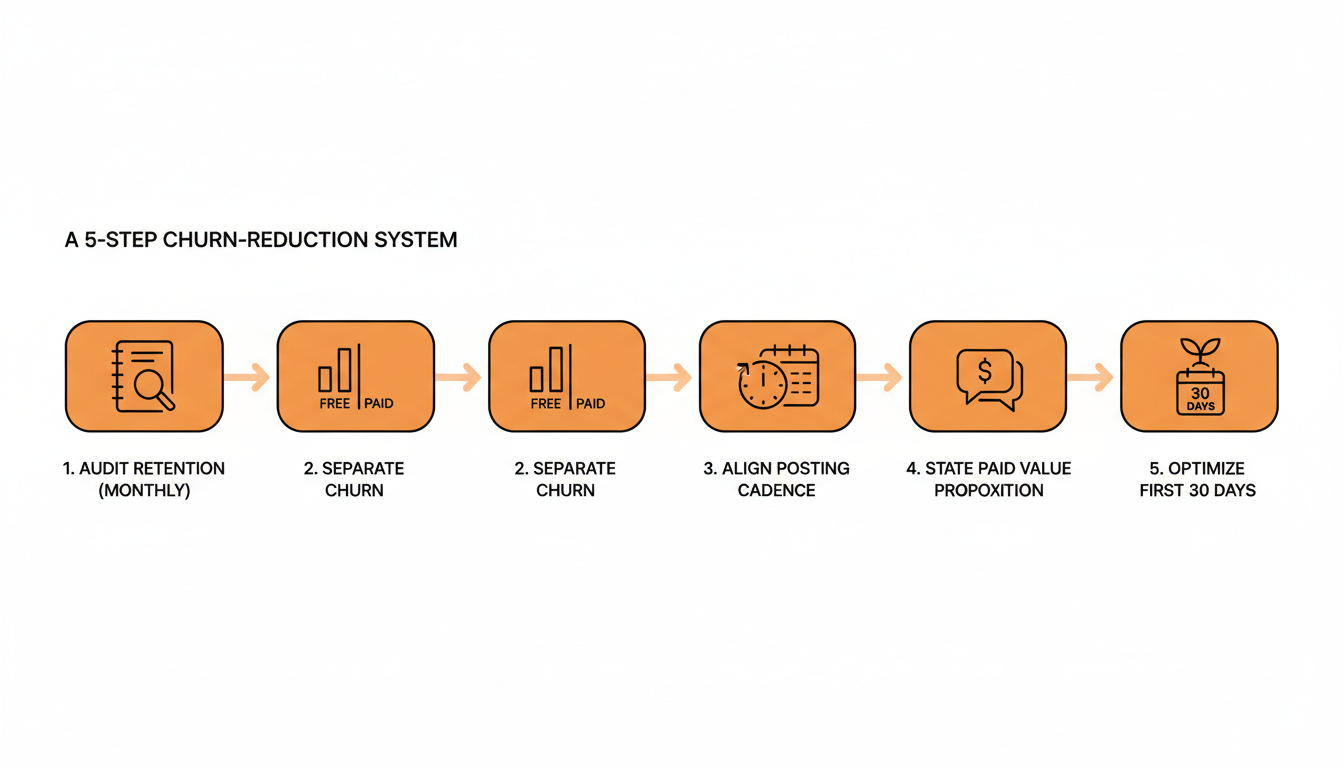
- Audit your Retention tab monthly, then check it against the field. Cohort analysis first, paid churn percentage second, and WriteStack's cross-publication benchmarks third so you know whether the month was actually bad or just felt that way.
- Separate free churn from paid churn. They have different causes and different fixes, and lumping them together hides which one needs attention. Link-click history across your Notes tells you which acquisition source each group came from.
- Match posting rhythm to capacity, not a fixed rule. The data above suggests rushed, frequent posts underperform a publication's own baseline. Post what you have the material and time for, and fill the gaps with a queue rather than with filler posts.
- State your paid-only value in one sentence. If you cannot, that is the actual project this month. A scheduled weekly chat for paying subscribers is the fastest way to make that sentence true.
- Fix the first 30 days for new subscribers. A clear welcome email and a fair first post do more retention work than almost anything published after month one.
Practical rule: run this check on the same day every month. Churn work that only happens reactively, after a bad month, tends to get skipped the moment things look fine again.
What Three Months of Watching the Right Numbers Changes
Most writers who feel like they are constantly fighting churn are fighting a visibility problem wearing a content problem's clothes. They do not know their own cohort curve, do not know which Notes brought their weakest subscribers in, do not know which readers have gone quiet, and have no idea whether their numbers are normal for a publication their size. Every one of those unknowns gets resolved into the same conclusion by default: my writing is slipping.
Three months into actually watching the right numbers, the change is not that you lose fewer subscribers, though that usually happens too. The change is that a cancellation stops being a verdict. You see it land, you check which cohort it came from, you see the curve is flattening rather than falling, you see your retention running above typical for your size, and you go back to writing. The hours that used to go into interpreting a single email go into the paid tier that keeps the rest of them.
That is the layer WriteStack ships: link-click tracking across your full Notes history, benchmarks against other publications instead of against your own last month, trend analysis that shows direction, chat post scheduling that no other tool in this category offers, and AI drafting that reads what you have already published. Close to 100 verified reviews from Substack writers back that up, and no competing tool has any we could find anywhere.
Start a free 7-day trial. Open your retention numbers next to the field, and find the Note that has been quietly bringing in the readers who stay.